Zoom on Japanese Candlesticks
Zoom - Japanese Candlesticks
By Crypto Nation – 06 December 2020
Japanese Candlesticks are the most common form of price display in trading. They are composed of a body, and wicks.
By default, a green candle indicates a price increase. Conversely, a red candle results in a drop of the price.
This display format is the most complete, because a single candle gives us 4 pieces of information :
- The opening price.
- The highest price reached.
- Conversely, the lowest price reached.
- And the closing price.
Japanese candlesticks are used in Technical Analysis (TA) of a market to represent price changes. Technical analysis over a past period is supposed to give indications on the future direction of the market or a price.
We then distinguish several types of Japanese candlestick figures, the most common being:
- Marubozu: Indicates a strong impulse.
- Its body is full.
- it has no, or very small wicks.
- It can be bullish or bearish.
- Doji: Sign of hesitation.
- it has no body.
- its wicks are long.
- There are several types of Dojis, but are always hesitant.
- Spinning Top: Sign of hesitation.
- Almost no body.
- The wicks are long.
- Similar translation to Dojis, we see hesitation.
- Hammer: Translates into a sign of bullish impulse.
- Defined by a small bullish body.
- With a long wick down, without wick up.
- Can also be compared to a rocket.
- Shooting Star: Irregular pulse sign.
- Has a small bearish body.
- With a long wick upwards, and without a low wick.
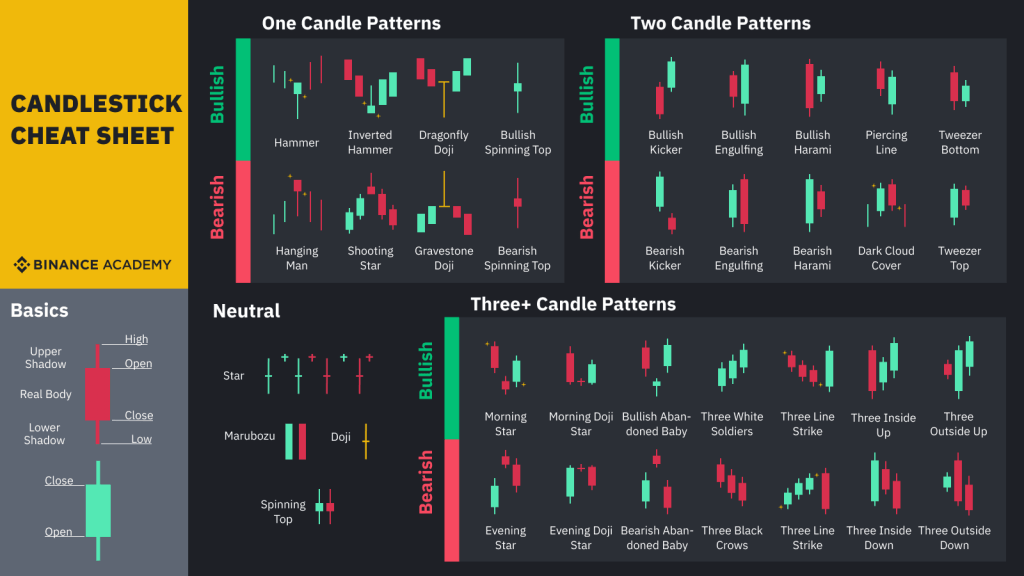
Credit : Binance Academy
Explanatory video
Below, you’ll find a detailed video on the technical analysis of Japanese candlesticks, made by our partner Zone9. This content is in French.